
The Apparel Size Chart Checklist That Prevents Expensive Guesswork
A practical field guide for checking the measurement, assignment, display, and mobile details that make Shopify size charts useful.
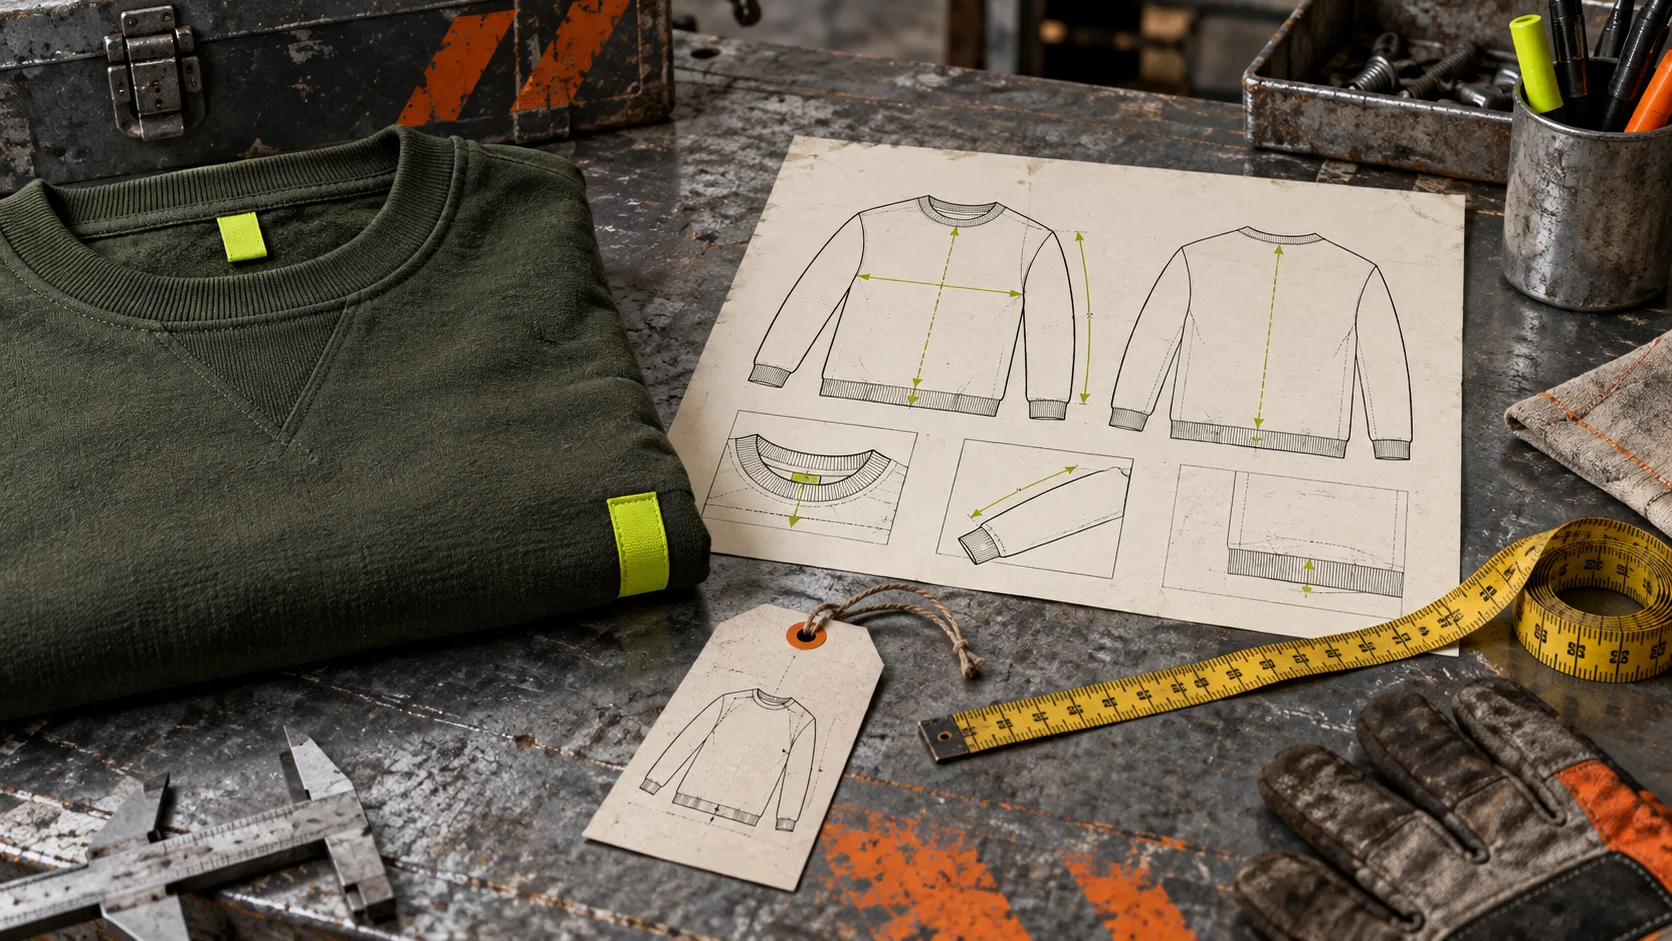
A size chart is one of the few product-page tools that can answer a costly question before it becomes a return: will this fit the way the shopper expects? The chart does not need to be elaborate. It needs to be accurate, easy to find, and clear about what the numbers mean.\n\n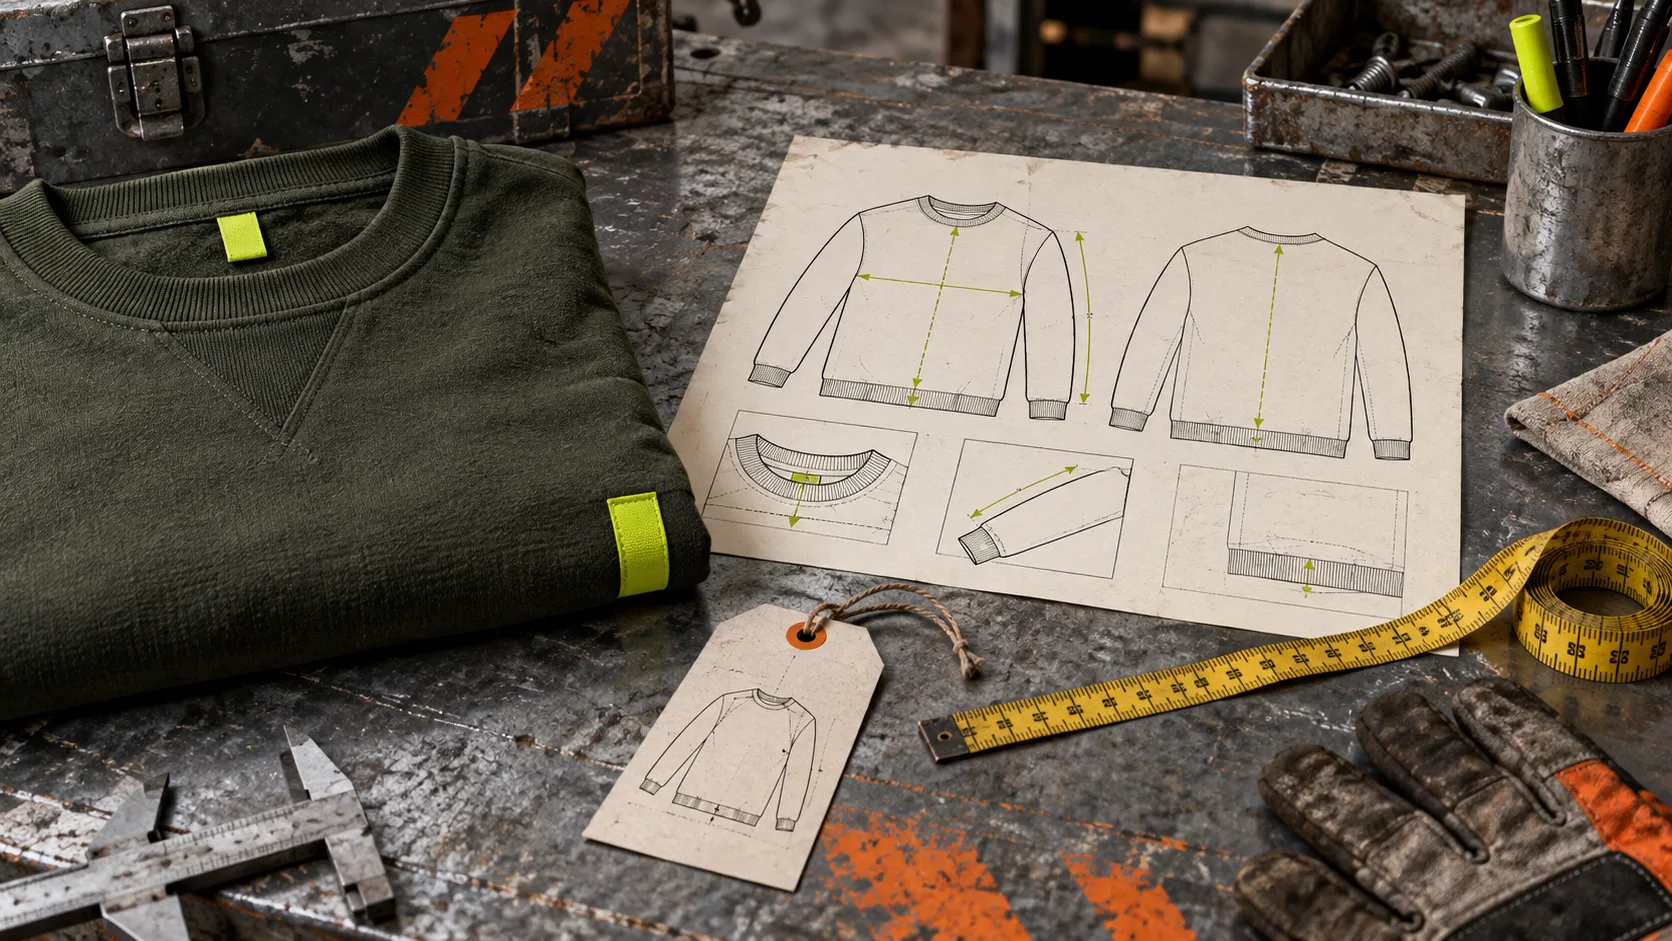 \n\nThis checklist is for Shopify stores that want a size-guide system rather than a collection of pasted tables. Supra Size Chart lets you create charts centrally, attach measurement guides, assign them through catalog rules, and show them with a theme app block. The tool is useful, but the quality comes from the checks you run before a chart reaches a product page.\n\n## 1. Confirm whether the chart measures the garment or the body\n\nThis is the first line a shopper needs, and it is often missing. A garment measurement is taken from the product laid flat. A body measurement is taken from the person. A chest width of a shirt is not the same as a full chest circumference.\n\nState the method near the table. Use plain language such as “Garment measurements, taken flat” or “Choose your size from body measurements.” That short note prevents a shopper from comparing incompatible values.\n\n
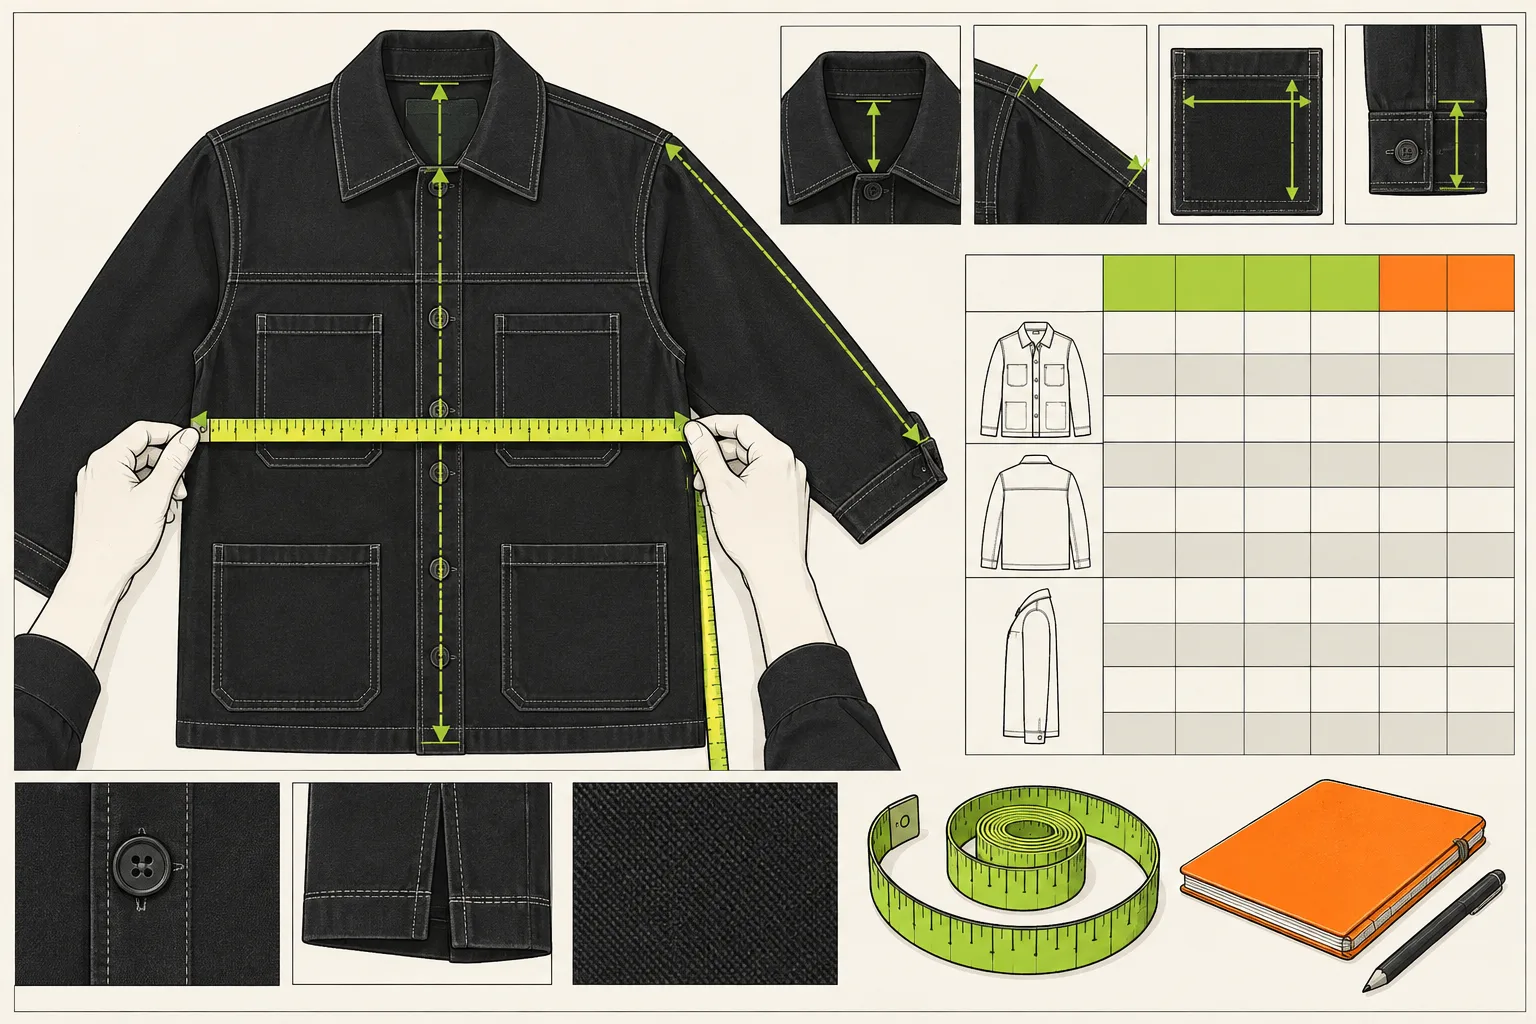 \n\nBefore publishing, check the source values against a real sample. Measure more than one size when possible. If the supplier gives you a table, verify that its labels match the garment you are selling. A clean layout cannot save inaccurate source data.\n\n## 2. Keep only the columns that help someone decide\n\nMore columns do not automatically make a chart better. A basic t-shirt may only need size, chest width, and length. Trousers may need waist, hip, rise, and inseam. Footwear usually needs a foot-length reference and a regional size conversion.\n\nChoose the columns based on the product and the decisions customers ask you about. If a column does not help someone choose a size, move it to a product specification or remove it. Dense tables become harder to read on mobile and make the important values less obvious.\n\nAdd a short fit note when it matters: slim, regular, relaxed, oversized, stretchy, or structured. A fit note gives the numbers context without pretending every body or preference will match the same way.\n\n## 3. Make the measurement guide use the same labels\n\nA table says what the numbers are. A measurement guide shows where they came from. The two should use the same terms. If the chart calls a value “inseam,” the diagram should not call the same line “leg length.”\n\nSupra Size Chart includes reusable measurement guides with garment silhouettes and labelled lines. Use one when the customer could reasonably measure a similar item at home. The visual guide is especially helpful for customers who do not already know how a brand defines chest, waist, rise, or length.\n\n## 4. Assign charts through rules, not copied product descriptions\n\nThe maintenance burden grows quickly when the same HTML table is pasted into every product description. A chart update then becomes a catalog-wide editing task, and inconsistencies creep in.\n\nCreate the chart once and assign it to products using a rule. You can target a product, collection, product type, vendor, or tag. That lets a shirt chart cover a whole collection while a special cut or material can receive its own more specific guide.\n\n
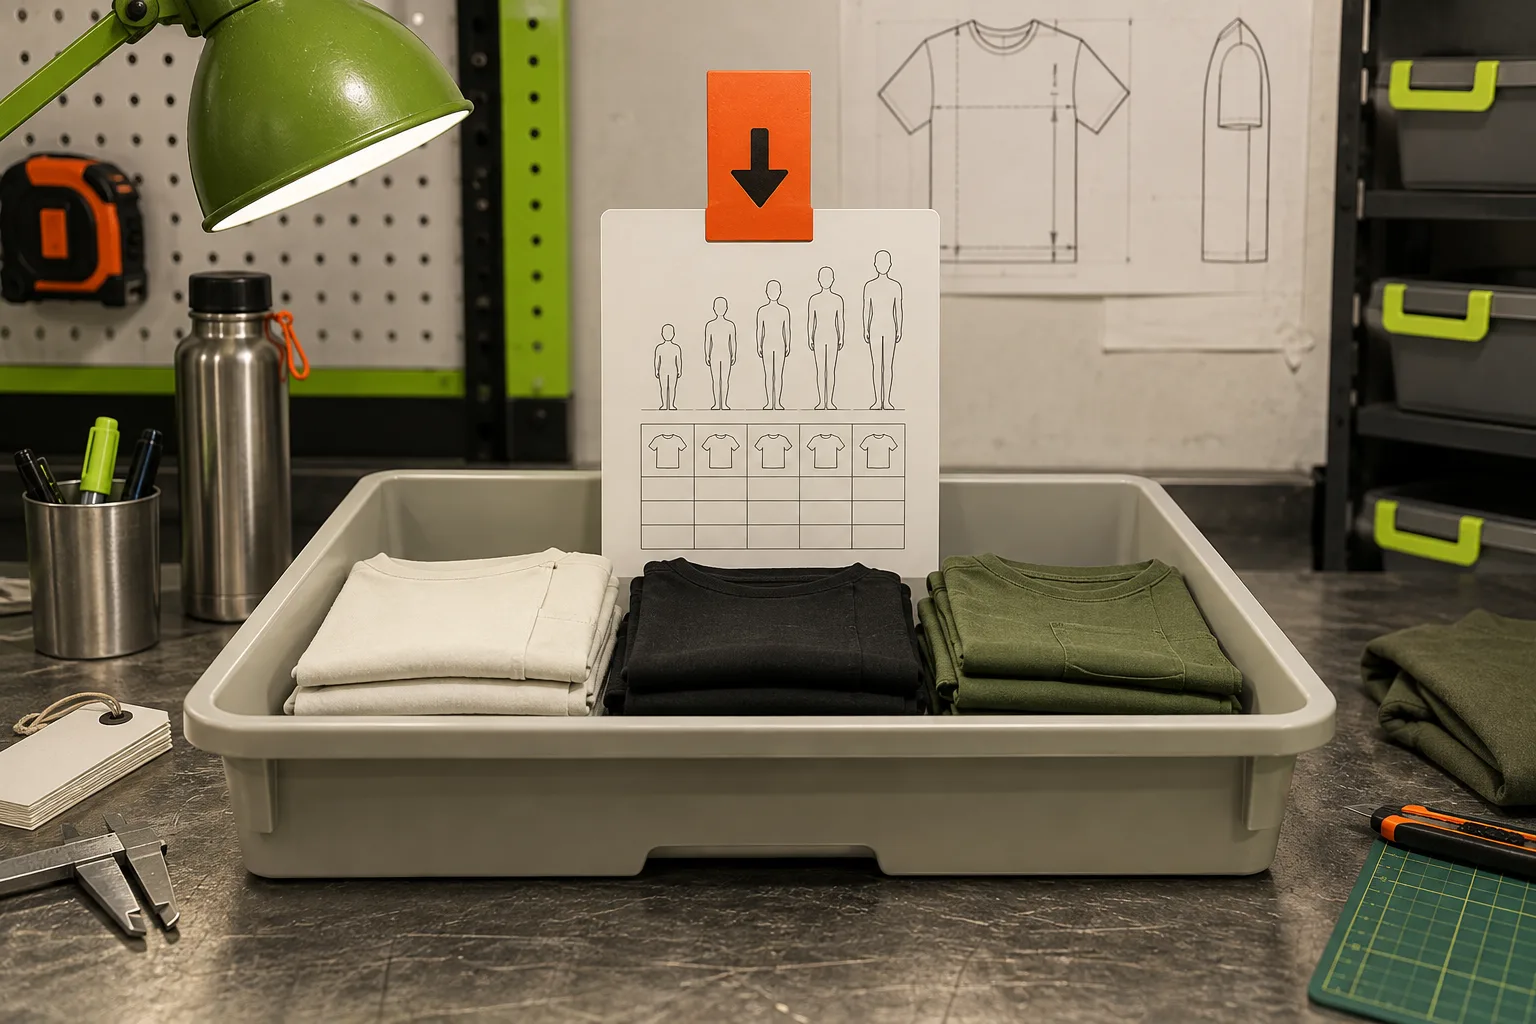 \n\nTest the rule with one product before treating it as a catalog solution. Confirm that the correct chart appears and that a more specific rule takes priority where it should. A store-wide default can help as a fallback, but it should not hide a missing product-specific chart.\n\n## 5. Give international shoppers a familiar unit\n\nIf your customers use different measurement systems, make the chart easier to read in both. A metric and imperial switch can save a shopper from leaving the product page to calculate a conversion.\n\nSet a base unit for each chart column and check the converted values for sensible rounding. Do not overload the table with excessive decimal precision. The goal is a helpful comparison, not a laboratory report.\n\nAlso check that the unit toggle is visible on mobile and that a shopper can tell which unit is currently selected. A unit switch that changes values silently can create another kind of confusion.\n\n## 6. Put the chart beside the size decision\n\nPlace the size guide near the size selector, not after several screens of description text. A shopper should be able to open it while they are choosing a variant.\n\nThe right display depends on the product page. An inline table works when the guide is central to the purchase. An accordion keeps the page compact. A modal can give a detailed measurement guide more space. Supra Size Chart supports all three through its Shopify theme app block.\n\n
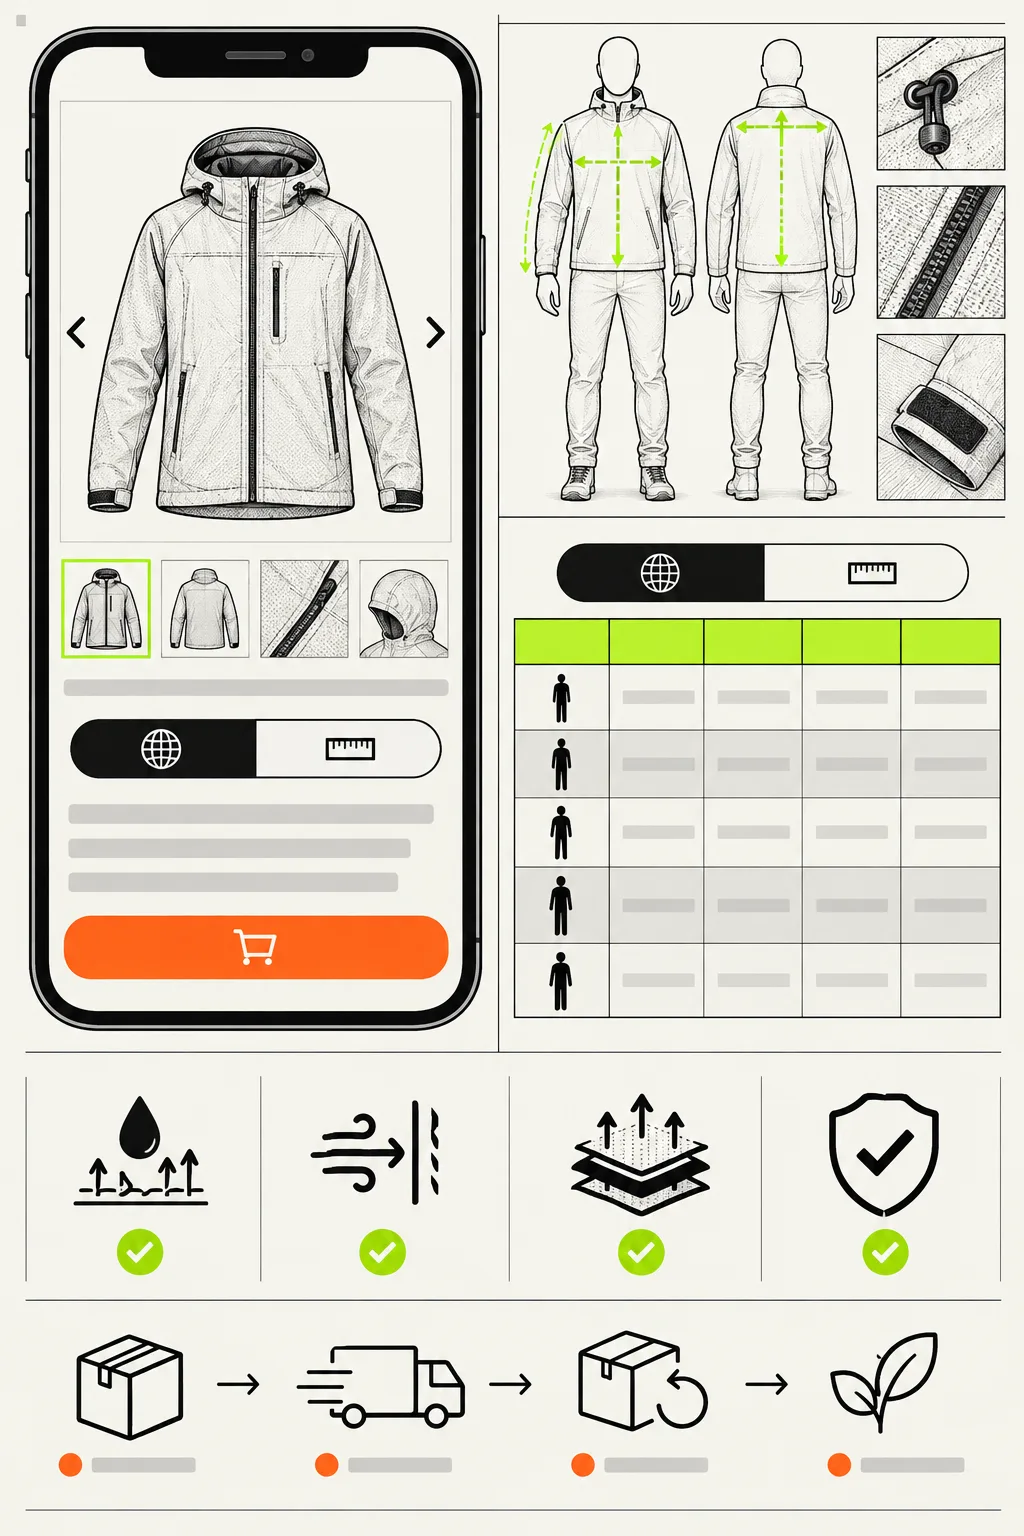 \n\nTest the page at a narrow width. Check that columns remain readable, the guide does not push the Add to cart button too far away, and the active unit is clear.\n\n## 7. Run a final shopper test\n\nAsk someone who did not create the chart to choose a size using only the product page. Watch where they pause. Do they understand what to measure? Can they find the guide? Do they know whether the values refer to the garment or their body?\n\nThat test is more useful than debating the chart internally. The aim is not to eliminate every return. Fit is personal, and products vary. The aim is to give a customer a better basis for choosing before they order.\n\n## Field-manual recap\n\nVerify the base measurements, remove unnecessary columns, match the guide labels to the table, assign charts through clear catalog rules, provide familiar units, and test the display where the customer actually makes a size decision. Supra Size Chart can keep that system consistent across the catalog, so a useful size guide does not become another repetitive maintenance job.